By Kshetez Vinayak, founder of SupaSidebar. Last updated 2026-06-16.
TL;DR
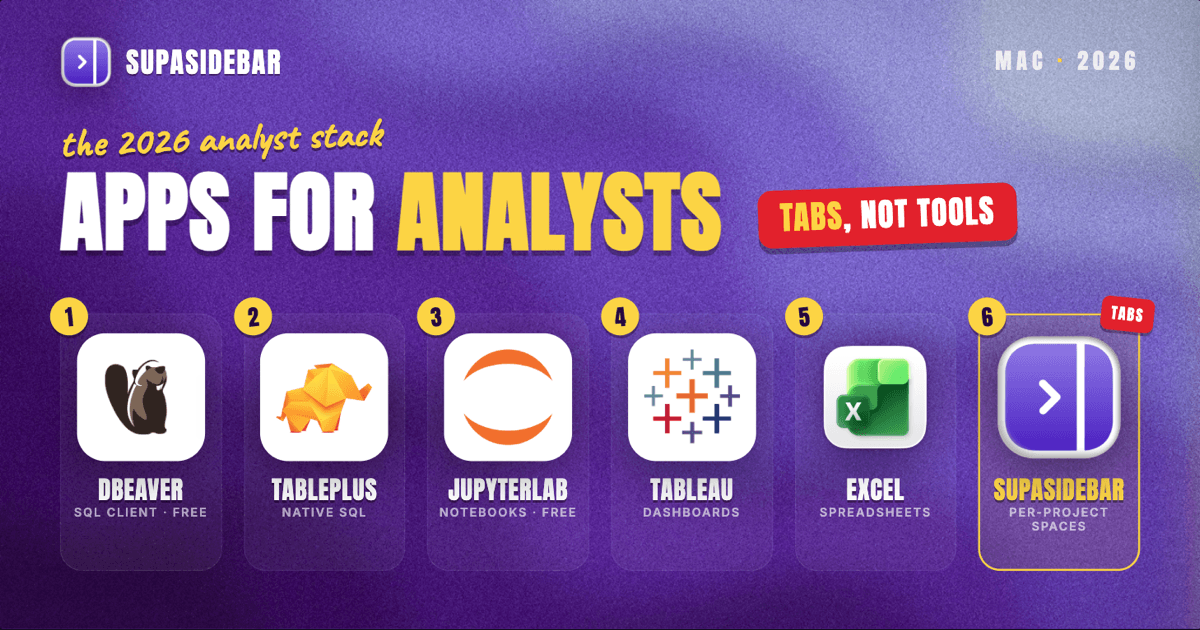
The best Mac apps for data analysts in 2026 are a five-app stack: DBeaver for querying any database for free, TablePlus when a faster native SQL client is worth paying for, JupyterLab for Python and R notebooks, Tableau Public or Tableau Desktop's free local edition for visualization, and Excel or Apple Numbers for the spreadsheet work that never goes away. Then SupaSidebar to keep each project's dashboard and documentation tabs organized across browsers, because the real Mac analyst problem in 2026 is not a missing tool, it is 40 open tabs spread across Chrome, Safari, and Firefox. Three of the five core tools have a genuinely free path.
Quick navigation:
- Building an AI or data engineering coding stack? → Best Mac Apps for AI Coders 2026
- Working remote and want a portable setup? → Best Mac Apps for Remote Workers 2026
- Trying to set up a Mac for focused deep work? → Mac Workspace Setup for Deep Work 2026
- Data analyst building a Mac app stack? You are in the right place. Keep reading.
| App | Job in the stack | Pricing model | Best for |
|---|---|---|---|
| DBeaver | SQL client, any database | Free Community (open source); paid tiers from ~$113/yr | Free, database-agnostic querying |
| TablePlus | Native Mac SQL client | ~$89 one-time per device, optional paid upgrades | Analysts who want native speed |
| JupyterLab | Python / R notebooks | Free, open source | Cleaning and modeling past spreadsheet scale |
| Tableau (Public / Desktop) | Visualization and dashboards | Public free (public only); local free edition; Creator ~$75/mo | Interactive dashboards stakeholders use |
| Excel / Numbers | Spreadsheets | Excel ~$99.99/yr (Microsoft 365); Numbers free | Excel for teams, Numbers for free solo work |
| SupaSidebar | Dashboard and doc tabs per project, across browsers | Free version available | Several projects' tabs across browsers |
The analyst stack is smaller than the listicles claim
Search "data analysis software for Mac" and the directory sites return 40-tool grids: Tableau, Qlik, Looker, Dataiku, Minitab, and a dozen more enterprise platforms (Capterra and SourceForge both run this format). Almost none of those are apps an individual analyst installs on a personal Mac. The working stack is five tools across four jobs: query the database, explore in a notebook, visualize, and wrangle spreadsheets.
The useful 2026 detail is how much of that core is free. DBeaver's Community edition queries every major database at no cost, JupyterLab is free and open source, and both Tableau Public and Apple Numbers cost nothing. A capable Mac analyst setup runs at zero dollars until a faster SQL client or business-grade Tableau becomes worth paying for. The rest of this list is which tool to default to for each job, and where each one actually falls short.
Querying any database, free or fast
For a SQL client on a Mac, use DBeaver if you want free and database-agnostic, or TablePlus if you want native speed and will pay for it. Most analysis starts with a query, and the SQL client is the app open all day, so the choice comes down to whether speed is worth a license fee.
DBeaver Community is the free default. It is open source under the Apache license and connects to essentially every relational database an analyst touches, Postgres, MySQL, SQL Server, Oracle, SQLite, plus a long tail of others. It runs on Java, so it is cross-platform and consistent, and the Community edition already includes the SQL editor, data grid, and export tools. The paid tiers (Lite, Pro, Enterprise, Ultimate, starting around $113 per user per year) add NoSQL and cloud-warehouse connectors, which matter for some teams and not at all for others.
TablePlus is the paid native alternative, and the difference is feel. It is a true Mac app rather than a Java port, so it launches fast, stays responsive on large result sets, and matches macOS conventions. It uses a perpetual-license model, roughly $89 for a single device with optional paid upgrades, and supports the same broad set of relational and NoSQL databases. The honest framing: DBeaver does the job for free, TablePlus is the upgrade you feel every time a query returns 50,000 rows.
Best for: DBeaver for anyone who wants free and database-agnostic; TablePlus for analysts who live in the SQL client and want native speed.
Cleaning and modeling data in a notebook
JupyterLab is the notebook environment for Mac analysts, and it is free and open source. When the work moves past a single query into cleaning, joining, and modeling, the notebook is where it happens. It is the standard interactive environment for Python with Pandas, and it supports R, Julia, and dozens of other kernels through the same interface. The notebook format keeps code, output, charts, and written explanation in one document, which is exactly what an analyst needs when an analysis has to be re-run or handed to someone else.
The simplest way onto a Mac is JupyterLab Desktop, a self-contained app that bundles Python and launches notebooks without a terminal setup, and double-clicks .ipynb files directly. The trade-off with notebooks generally is discipline: it is easy to leave a notebook in a non-linear, out-of-order state that runs on your machine and nowhere else. The fix is a habit, restart-and-run-all before sharing, not a different tool.
Best for: every analyst doing Python or R work past spreadsheet scale. Skip it only if the work is purely SQL-to-dashboard with no scripting.
Turning analysis into dashboards a stakeholder reads
Tableau is the default Mac visualization tool in 2026, available as free Tableau Public, a free local Desktop edition, or the paid Creator license. The distinction between the three is privacy, not features. Charts are where analysis becomes something a stakeholder actually reads.
Tableau Public is free and fully featured for authoring, with one hard constraint: every visualization you save is published publicly to Tableau's web servers. That rules it out for company or confidential data, but it is genuinely capable for portfolio work, public datasets, and learning. Separately, Tableau Desktop offers a free edition that analyzes local files (Excel, CSV, databases) with full authoring stored on your machine. Business use at scale sits inside the paid Creator license, around $75 per user per month for the Standard tier, which bundles Tableau Desktop with the Cloud platform.
The honest limitation: Tableau is heavyweight, and not every chart needs it. For quick exploratory plots, a notebook with Matplotlib or a spreadsheet chart is faster. Tableau earns its place when the output is an interactive dashboard other people will use.
Best for: dashboards and interactive reports. Public for portfolios and open data, the local free edition for private one-off analysis, Creator for production.
The spreadsheet work that never goes away
For spreadsheets, use Excel if your team runs on it or you do heavy modeling, and Apple Numbers (free on every Mac) for light, solo, Mac-native work. Spreadsheets never leave the analyst workflow, no matter how much SQL and Python a job involves.
Excel is the standard for a reason: pivot tables, thousands of functions, Power Query, and macros mean nearly every analyst is fluent in it and nearly every stakeholder expects .xlsx. It requires a Microsoft 365 subscription, around $99.99 per year for the personal plan. Apple Numbers, by contrast, ships free on every Mac and handles personal-scale reporting and clean-looking one-off tables well, but it treats a sheet as a canvas of separate tables rather than one continuous grid, which trips up anyone whose muscle memory and templates are built around Excel's model.
The honest verdict: if an analyst's team runs on Excel, Numbers is not a real substitute, the compatibility friction costs more than the subscription saves. Numbers is the free choice for solo, light, or presentation-oriented spreadsheet work.
Best for: Excel for anyone in an Excel-based team or doing heavy spreadsheet modeling; Numbers for free, light, Mac-native spreadsheet tasks.
The dashboard-tab problem (the gap none of these close)
Here is what none of the tools above solves. A working analyst day is not one app, it is a browser full of tabs around the apps: the BI dashboard, the data dictionary, three Confluence pages, a Jira ticket, the metrics-definition doc, two Stack Overflow answers, the cloud-warehouse console, and the Google Sheet the finance team insists on. The analysis lives in DBeaver and Jupyter; the context around it lives in browser tabs that scatter and vanish.
It gets worse across browsers. As one Reddit user described their setup: "I use different browser for different workflows like Safari for social media, Chrome for web development, and Firefox for research." That separation is common and sensible, but it means the dashboard tabs in one browser, the documentation in another, and the warehouse console in a third never appear in one place. A browser's own tab groups cannot fix it, because each browser only sees its own tabs.
SupaSidebar
SupaSidebar is a native Mac app that adds one persistent sidebar across every major Mac browser - Safari, Chrome, Firefox, Edge, Arc, Brave, Vivaldi, Comet, Dia, and more (33 browsers counting channel variants). For an analyst the natural unit of organization is the project or the stakeholder, and that maps directly to Spaces: one Space per project, holding the dashboard links, data-dictionary pages, warehouse console, and ticket tabs together, plus local files and folders, since the sidebar saves items from Finder alongside links.
Three shortcuts carry the daily load. Smart Save (⌘⌃S) files the current dashboard or doc into the active Space without leaving the browser. Save All Browser Tabs (⌘⌃T) captures an entire analysis session into a folder in one stroke, so "those 40 tabs from the churn investigation" become a saved, reopenable set instead of a memory test. Command Panel (⌘⌃K) searches saved links and live tabs across every Space and every running browser at once, which ends the window-by-window hunt for "that metrics-definition doc." Live Tabs shows the open tabs from all running browsers in a single list, and iCloud sync keeps the same Spaces on a work Mac and a laptop with no account required.
The honest limitations: SupaSidebar is not an analysis tool, it organizes the tabs and files around the work, it does not query data or build charts. Its search covers titles and URLs, not the contents inside a dashboard or PDF. And it requires macOS 14 or later. A free version is available, and 3,000+ Mac users have tried SupaSidebar.
Best for: analysts running several projects or stakeholders in parallel, especially when dashboards and docs are spread across more than one browser.
Which data analyst setup should you pick?
- If you are on a tight budget: run an entirely free stack - DBeaver, JupyterLab, Tableau Public, and Numbers - and lose very little.
- If you are embedded in an Excel-and-Tableau company: pay for both rather than fight compatibility, and lean on the free SQL and notebook tools to save elsewhere.
- If you juggle several projects or clients: per-project organization is your biggest win - one SupaSidebar Space per client or investigation, so context never bleeds between engagements.
- If you live in Python: anchor on JupyterLab and treat the SQL client as a secondary window.
Conclusion: Picking the data analyst stack
The 2026 verdict: start free wherever the work allows. DBeaver, JupyterLab, Tableau Public or the free local Tableau edition, and Apple Numbers cover querying, scripting, visualization, and light spreadsheets at zero cost. Pay for TablePlus when the SQL client's speed is worth it, for Excel when the team runs on it, and for Tableau Creator when dashboards go to production. Add SupaSidebar the day dashboard and documentation tabs start spanning browsers and projects.
Try SupaSidebar (free tier) if a single analysis already has tabs scattered across browsers right now. For the surrounding setup, see the AI coders app stack for analysts who script heavily, and the deep-work Mac workspace guide for arranging the windows themselves.
Why we recommend SupaSidebar
SupaSidebar is a macOS app that brings Arc's sidebar to every browser - one sidebar for tabs, bookmarks, files, and apps across 33 browsers including Safari, Chrome, Firefox, Edge, Arc, Brave, Vivaldi, Comet, and Dia. For data analysts, it turns each project or stakeholder into a Space holding that work's dashboards, data dictionaries, warehouse consoles, and tickets, searchable in one keystroke with Command Panel (⌘⌃K) no matter which browser they are open in. iCloud sync keeps the same setup on a work Mac and a laptop, with no account required. macOS 14+ required.
FAQ
What is the best free SQL client for Mac?
DBeaver Community. It is open source under the Apache license and connects to nearly every relational database an analyst uses, including Postgres, MySQL, SQL Server, Oracle, and SQLite, with a SQL editor, data grid, and export tools built in. If native Mac speed on large result sets matters more than price, TablePlus is the paid alternative at roughly $89 for a single-device perpetual license.
Is Tableau free on Mac?
Partly. Tableau Public is free and fully featured, but it publishes every visualization publicly, so it is unsuitable for confidential company data. Tableau Desktop also offers a free edition that analyzes local files (Excel, CSV, databases) and keeps the work on your machine. Business use at scale needs a paid Creator license, around $75 per user per month for the Standard tier.
Do data analysts need Excel or is Apple Numbers enough?
It depends on the team. Apple Numbers ships free on every Mac and handles light reporting and clean tables well, but it treats a sheet as separate tables rather than one continuous grid, which breaks Excel-built templates and workflows. Analysts on Excel-based teams should keep Excel (about $99.99 per year via Microsoft 365); solo or presentation-focused work can stay on Numbers for free.
What is the best notebook app for data analysis on a Mac?
JupyterLab, which is free and open source and the standard interactive environment for Python with Pandas, plus R, Julia, and other kernels. JupyterLab Desktop is the easiest way to run it on a Mac because it bundles Python and opens .ipynb files directly with no terminal setup. The one discipline it demands is restarting and running all cells in order before sharing, so the analysis reproduces on another machine.
How do data analysts keep dozens of dashboard tabs organized on a Mac?
The reliable pattern is one workspace per project or stakeholder rather than one giant tab pile. SupaSidebar implements this across browsers: each project gets a Space holding its dashboards, docs, and warehouse tabs, Save All Browser Tabs (⌘⌃T) captures a whole session at once, and Command Panel search spans every browser's open tabs. Inside a single browser, tab groups work until the dashboards and docs cross into a second browser.
Can you do data analysis on a Mac without paying for software?
Yes. A capable free stack in 2026 is DBeaver Community for SQL, JupyterLab for Python and R notebooks, Tableau Public or Tableau Desktop's free local edition for charts, and Apple Numbers for spreadsheets. The paid upgrades (TablePlus, Excel, Tableau Creator) are worth it for native speed, team compatibility, and production dashboards respectively, but none of them is required to start.
By Kshetez Vinayak, founder of SupaSidebar. Last updated 2026-06-16.